 Let us help you in finding your best combination of technical indicator  We have over 25 years of professional experience in code programming 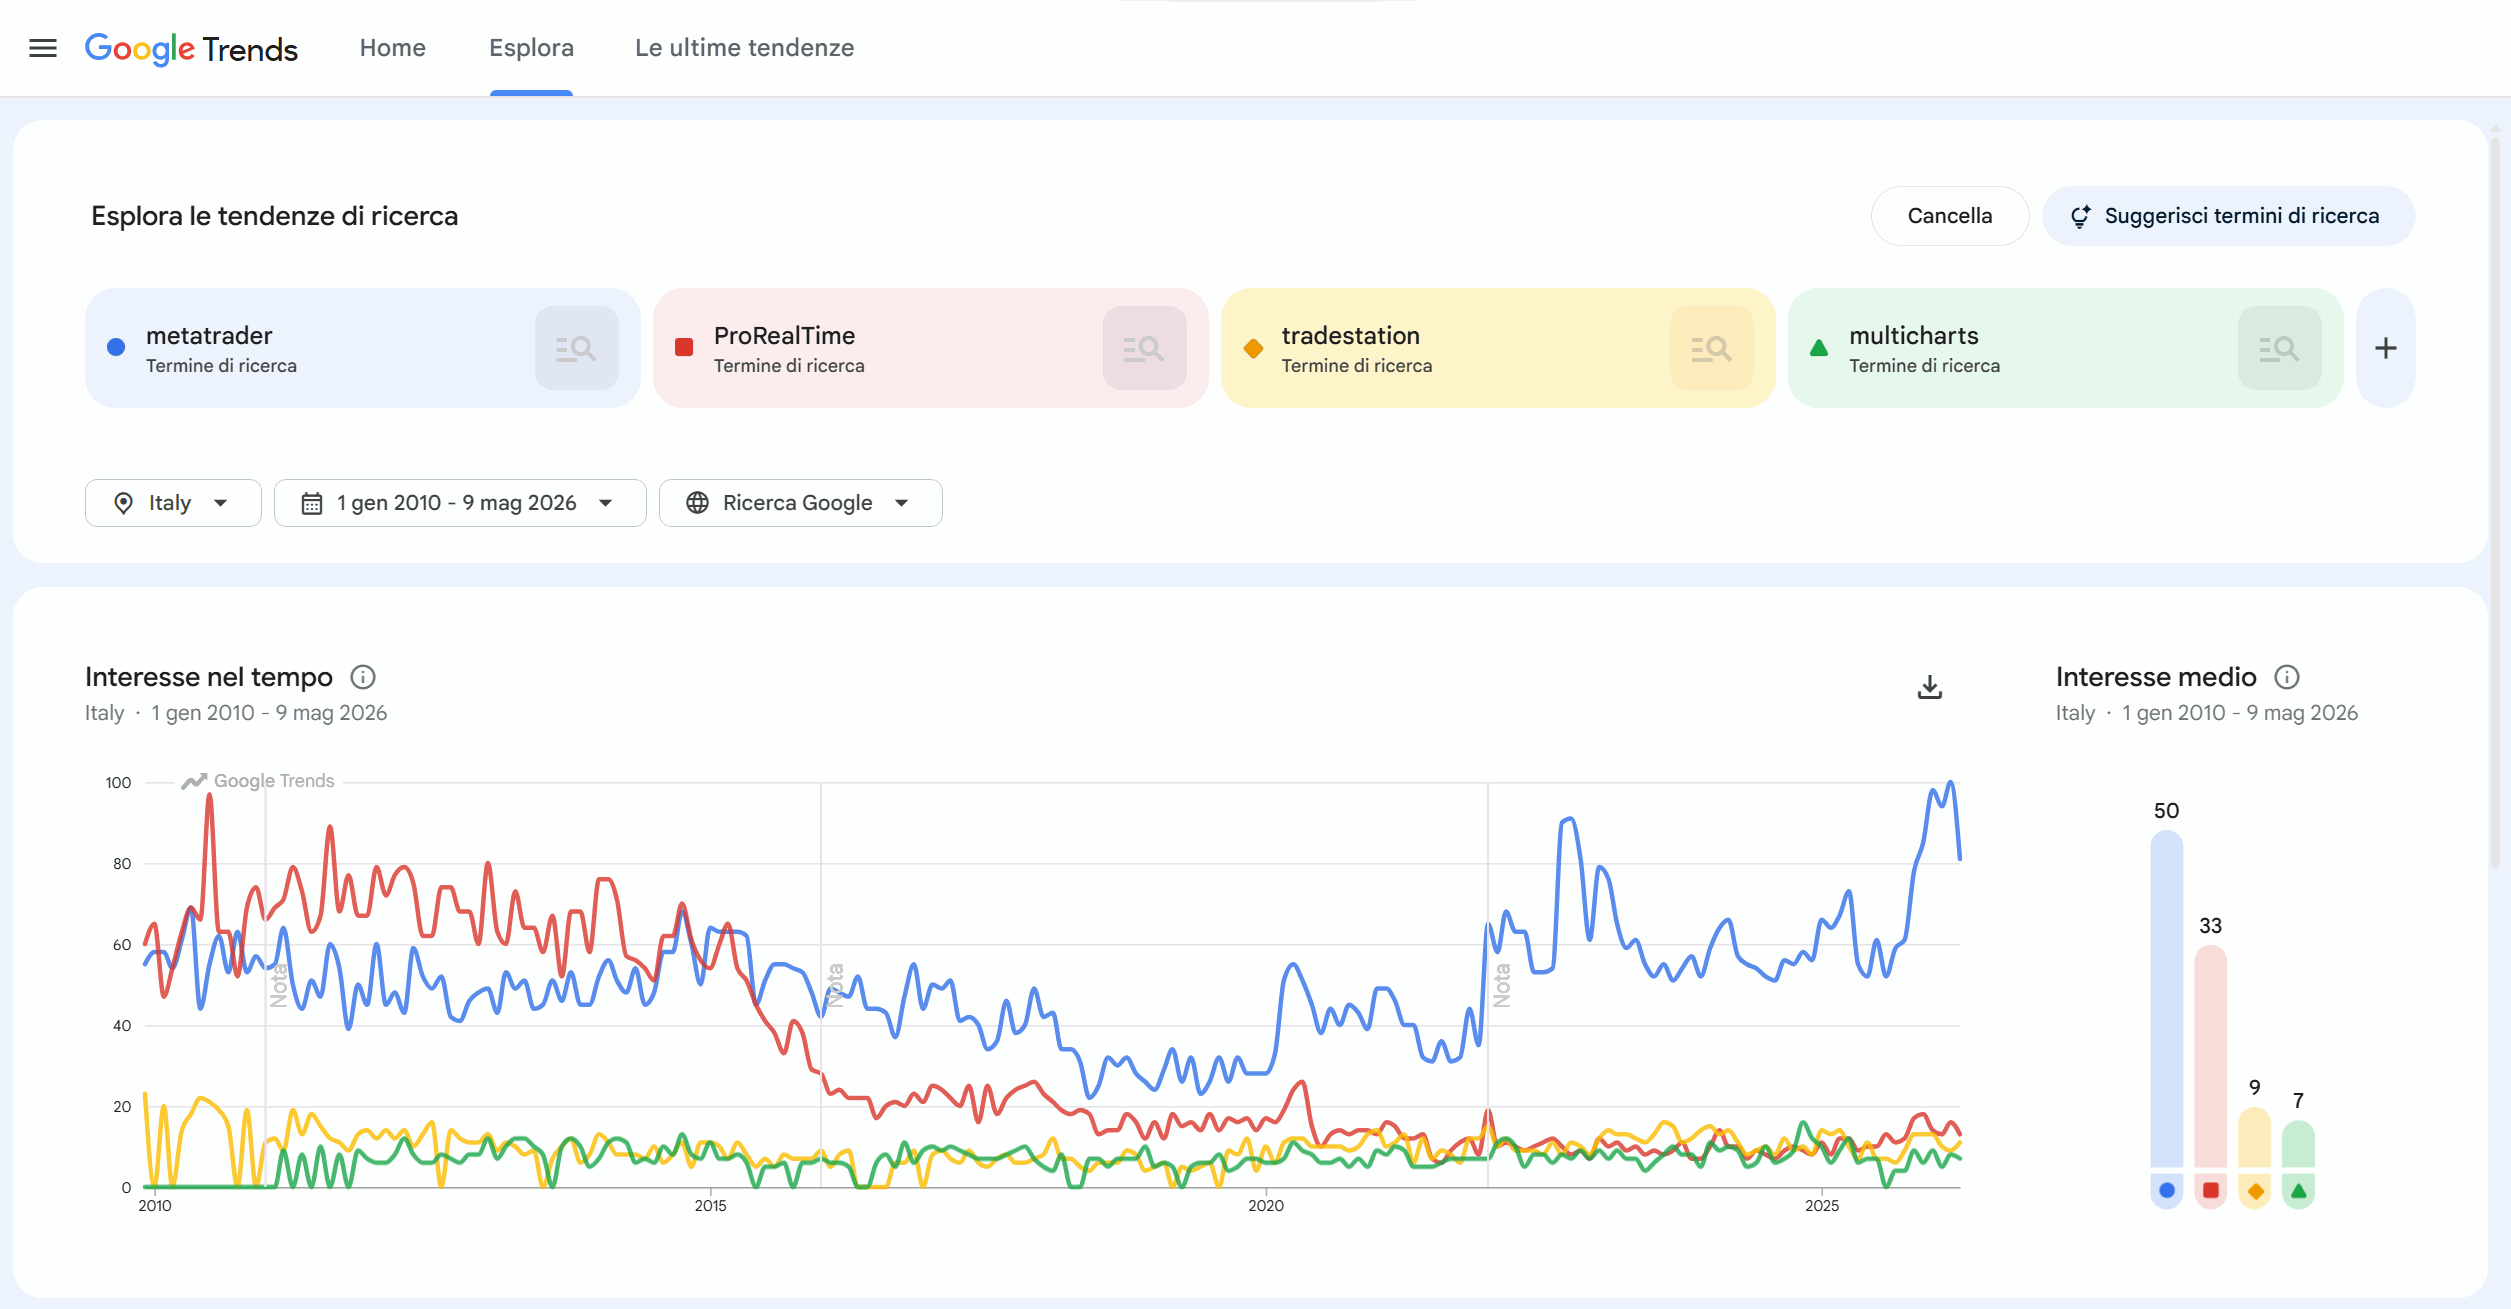 GoogleTrends about Metatrader and other platforms... 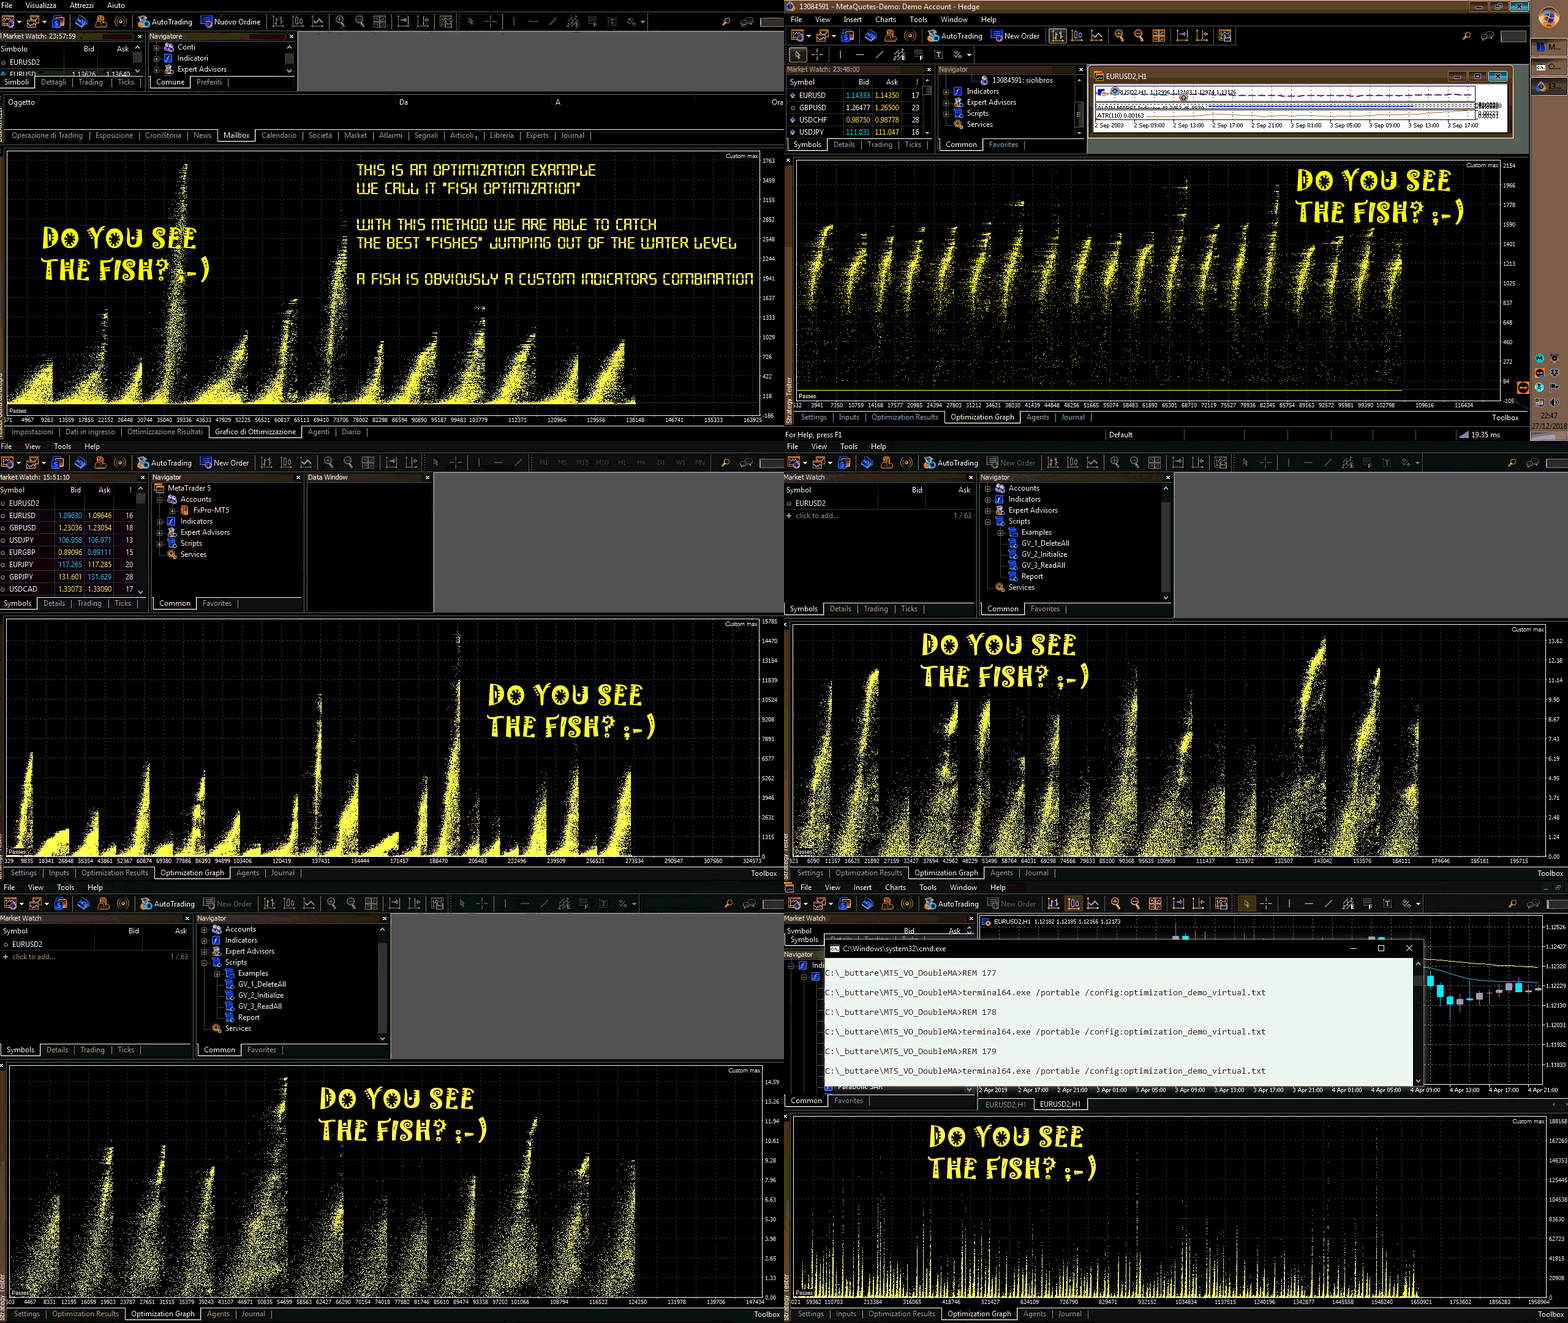 Fish Optimization Method Do you see the fish? ;-) 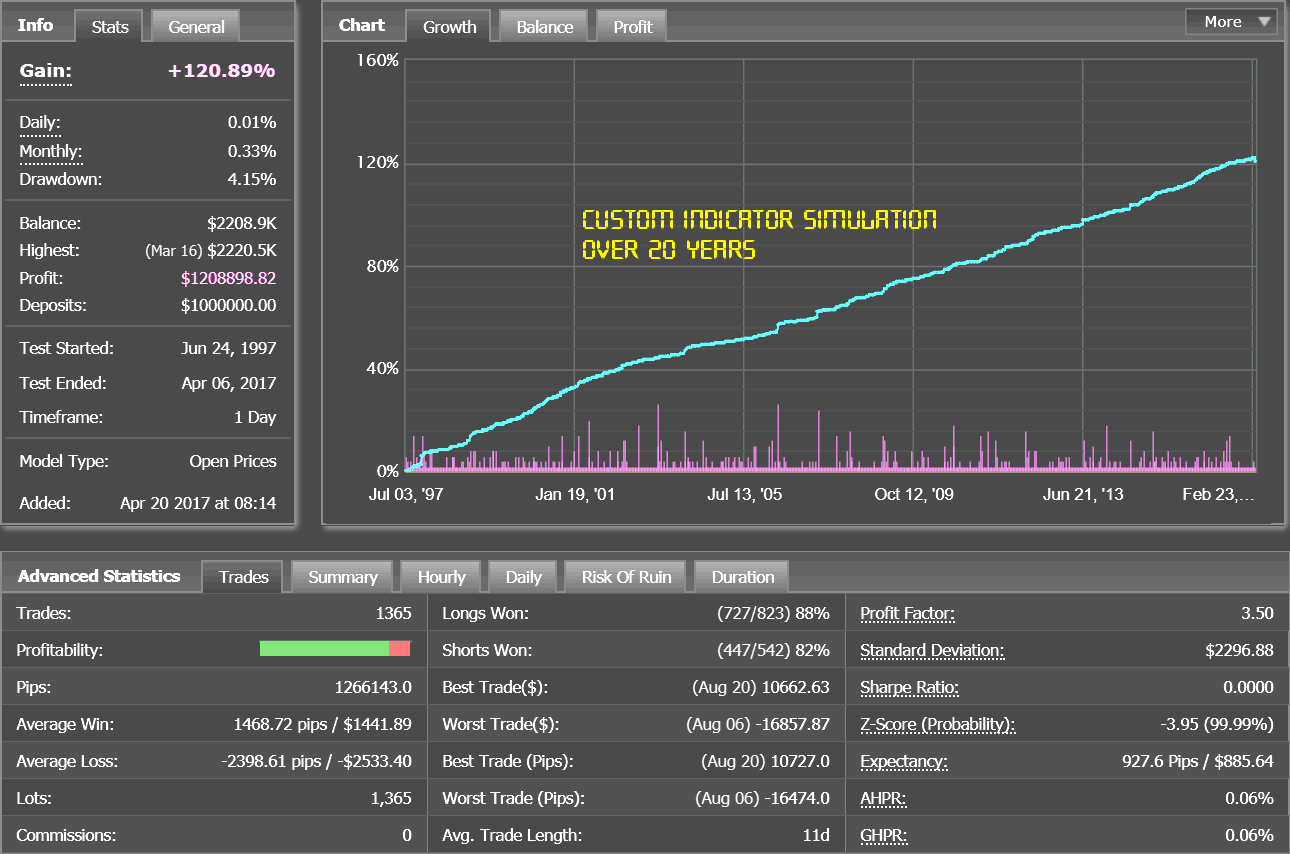 Custom indicator simulation over 20 years 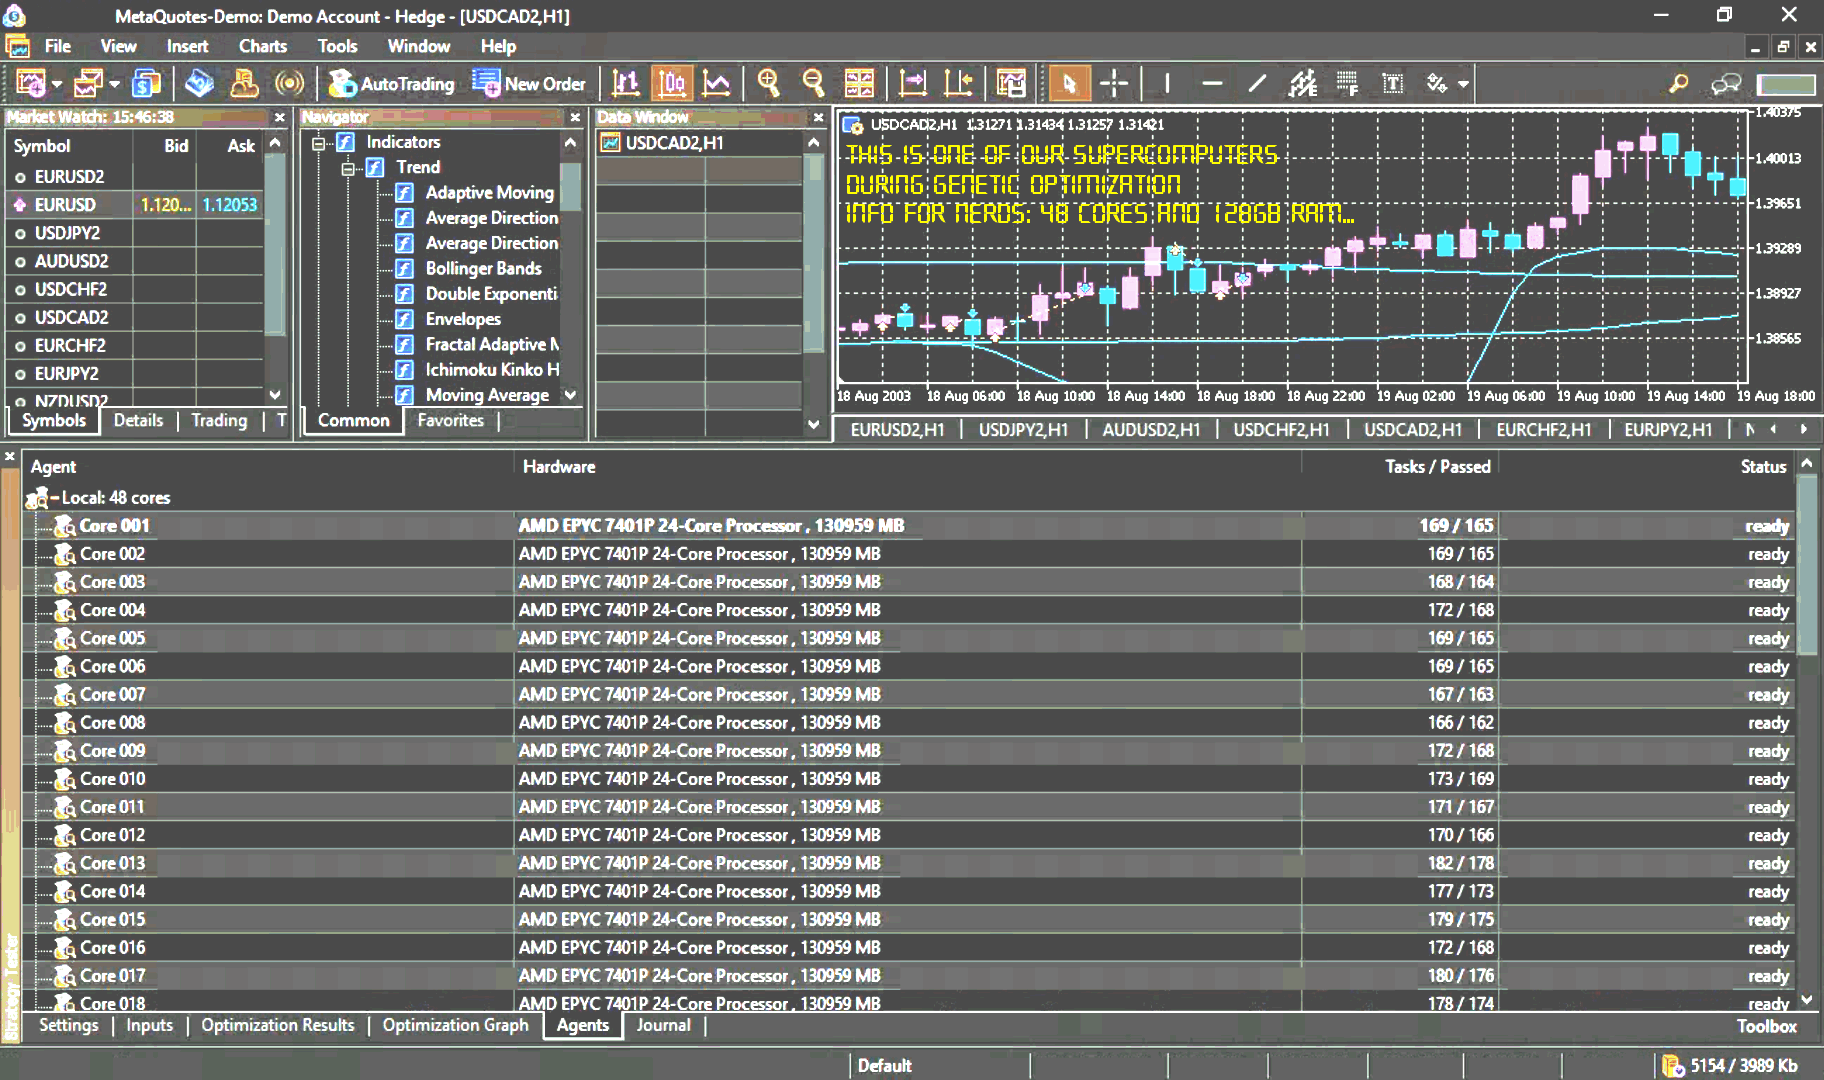 One of our supercomputers at work Quantitative Strategic Advisory: Beyond Visual Analysis Are you seeking to optimize your Asset Allocation but remain uncertain about the selection of specific financial instruments? Have you identified a target sector but lack a data-driven Entry Strategy? To evaluate the trajectory of a financial asset effectively, one must look beyond basic price action and "bar chart" visualization. In modern finance, an informed investment decision requires a robust Quantitative Framework. The most effective approach involves the deployment of Technical Indicators based on mathematical models designed to isolate the prevailing trend, volatility, and market conditions across specific timeframes. This analytical layer is essential to determine the optimal timing and exposure for your capital. The Categorization of Market Alpha In the current high-frequency environment, market analysis is inseparable from technical modeling. Whether utilizing native tools or engineering Custom Indicators, the possibilities for customization are vast. Indicators can be integrated into the primary price window or isolated in sub-windows, and can even be applied as derivatives of other indicators (e.g., a Moving Average of an RSI) to filter noise. We categorize the analytical landscape into three primary pillars:
The Path to Statistical Edge As detailed in our research published in SIAT Magazine (Issue 2-2019) a sustainable Statistical Edge is rarely found in a single metric. Every indicator has inherent limitations; therefore, the most robust solution is a Multi-Factor Composite Model. However, a "one-size-fits-all" approach is a fundamental error. A specific combination (e.g., an SMA coupled with an RSI) might show high predictive power on EUR/USD while failing to achieve statistical robustness on CAD/CHF. The critical challenge then becomes: How do we determine the optimal composition of indicators for varying market regimes? The Technology: MetaTrader 5 & Cloud Optimization To solve this, we chose MetaTrader 5 (MT5) as our primary analytical engine. As confirmed by global adoption trends, MT5 is the industry standard for retail and professional algorithmic trading, offering an unparalleled ecosystem of developers and deep liquidity integration. Crucially, it allows us to leverage Cloud Computing for high-performance Genetic Algorithm optimizations and exhaustive backtesting. TICES: The Technical Indicator Crossing Engine System MetaTrader 5 provides 38 standard indicators, which, when accounting for parameter permutations, offer trillions of potential combinations. Manually identifying the "Golden Cross" of these variables is computationally impossible and prone to Curve Fitting. To bridge this gap, we developed the Technical Indicator Crossing Engine System (TICES). TICES is a proprietary algorithmic framework capable of automatically synthesizing dozens of indicators within a single optimization cycle. By processing these variables simultaneously, TICES identifies the mathematically superior combination of indicators for any specific instrument and timeframe, ensuring a validated, systematic approach to market entry.
The reports and analysis services provided by this website must not be understood as operating advice in any way for direct investment or as a solicitation to public savings deposits.
The results presented - real or simulated - do not constitute any guarantee regarding hypothetical future performances. Siolibros assumes no responsibility for any direct or indirect damage in connection with investment decisions taken by the customer. |